Navigation Functions
Constructing cartographic dimensions is easy. A straightforward data model with standard Smallworld geometries (points, lines and texts) is implemented and can be used for all applications as well as sector-specific data models.
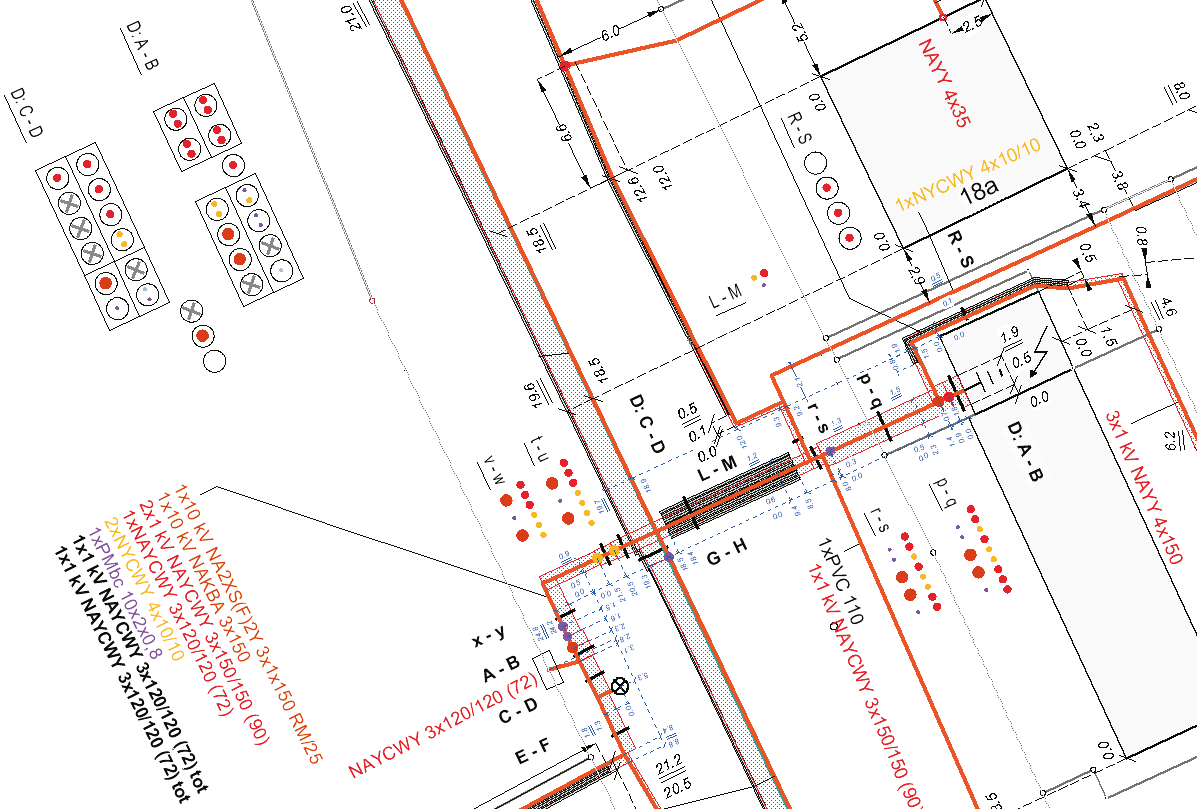
Various methods for navigating between important objects of a trail are available, for example from route to cable, from cable to trail, from trail to cable and many more. Visualising, highlighting and editing functions are always available. It is also helpful to directly navigate from the spherical cross section to the cable section that is highlighted.
Functions such as disconnecting a cable and rerouting electricity or synchronising windows as well as switching to a spherical cross section view compliment the product well. In addition, the trail magnifying function can be activated on any given point with just a mouse click. As a result, a window opens and cables can be edited.
Functions (an excerpt)
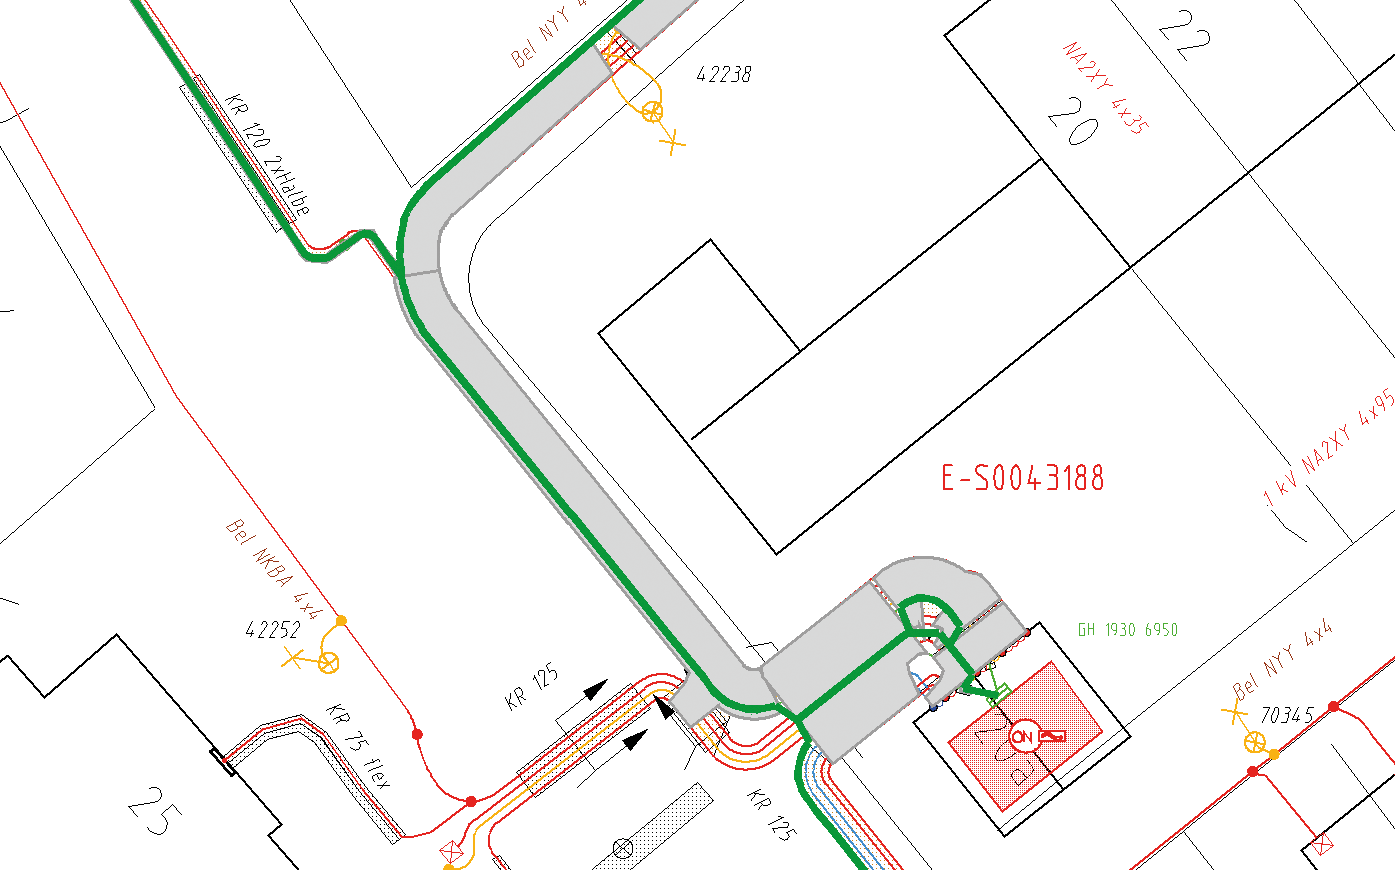
- Trail surface area is an object in the detailed map and contains references to all cable sections, pipelines etc.
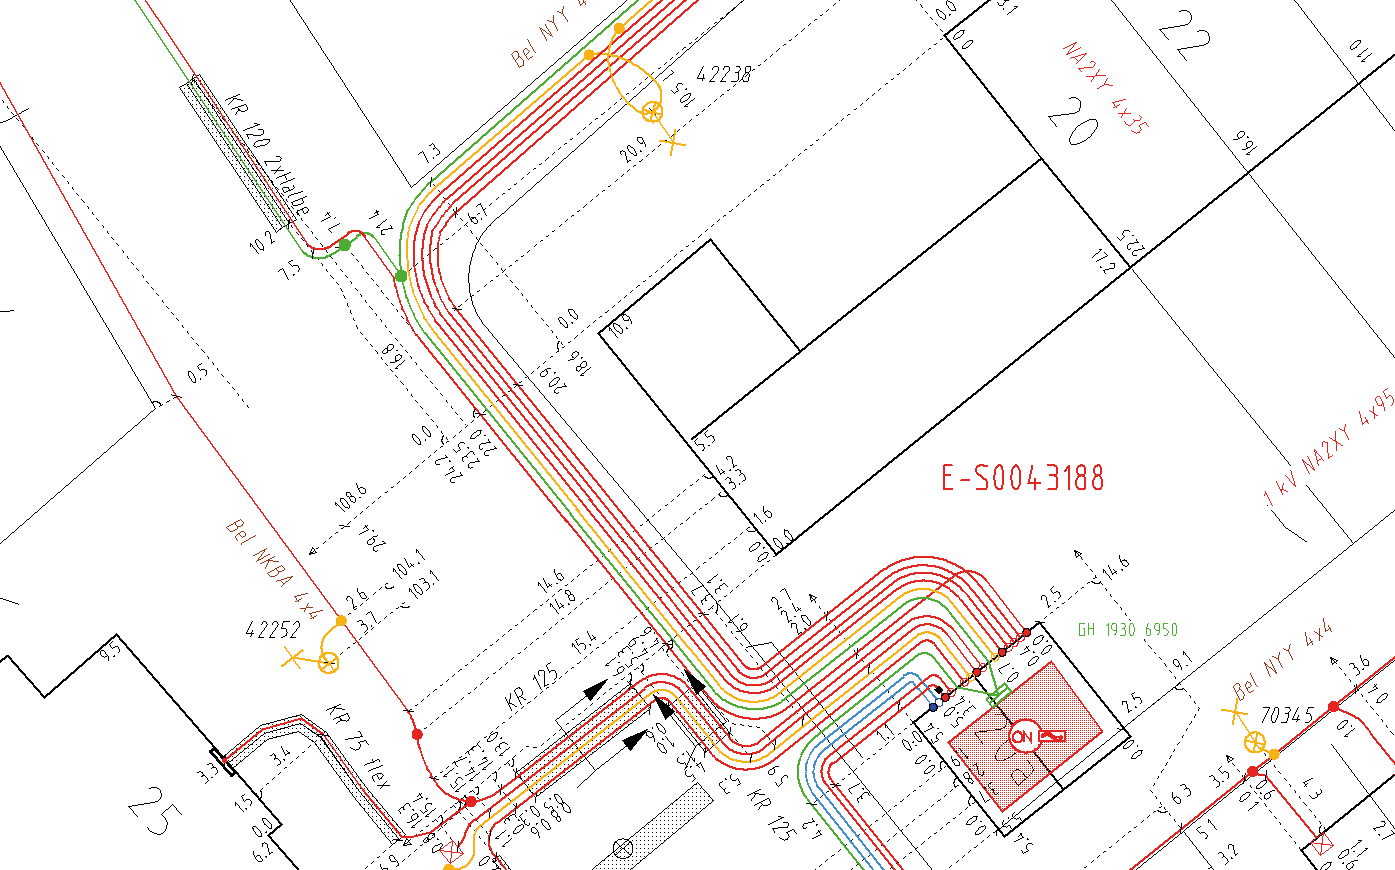
- Style visualisation depends on number of cables
- Editor for trail surface area: adding, displaying, highlighting, removing, special editor for merging, dividing trail surface areas, creating trail surface areas, network analyses
- Disconnecting and rerouting electricity
- Fittings: Visualising, adding and removing fittings
- Trail surface area labelling
- Trail-specific functions for connected electricity objects
- Optimised TN inspection
- Displaying child objects in additional editors
- Managing the cross section visualisation
- Right-click mouse functions for displaying the internal world of a cross section
- Highlighting cable sections and routes
- Displaying a list of cross sections for a specific cable section
- Implementing a trail module for a detailed or overview map
- Synchronising numerous GIS windows whilst editing
Advantages
- Quick and cost-efficient data editing, optionally based on a detailed or overview map
- Editing individual cables is not required
- Reducing topology redundancy
- Easy and cost-effective grid documentation
- Maps have a higher precision by precisely depicting cable locations without generalising
- Higher transparency, which in turn produces better results for grid management and other applications
- Main grid map is quickly available for data editing projects
Support and Consultation During Trail Documentation
Concept
We listen to your aims and analyse the current state of your grid documentation including all GIS data. You will receive a recommendation including a concept for your future trail documentation. In the process, we will compare a set of solutions ranging from an easy documentation to an intelligent trail surface area solution for both the detailed and overview map. The analysis includes a calculation of futue cost savings.
Pilot Phase
Within the pilot phase, we will convert specific excerpts of the power grid into a trail. The real trail surface area is then reconstructed based on ALKIS. In the process, we will, for example, shift all cables of the detailed map into the trail surface area or delete cables that already exist in the overview map. Afterwards, we will add cartographic dimensions of the trail surface area. The results of the pilot phase can be used to convince users of the application.
Preliminary Study
We will evaluate the trail precision based on your data. In the process, themes, models, functions and visualisations are compared quantitatively and qualitatively. This includes object and attribute counts as well as non-depictable (missing) model components. In order to achieve the best functional results, we will also create function comparisons for use cases. Finally, various visualisations are compared to one another and tested using plots of specific grid excerpts based on the pilot phase.