Evaluating und analysing Power Grids
ITS Power Grid Analysis is used to topologically evaluate and analyse power grids based on the Smallworld sector-specific data model for electricity. Topological and aerial analyses are visualised in colour. Furthermore, results are displayed in lists within Smallworld GIS. These lists can be exported to Microsoft Excel.
- Analysis of network topology and structure
- Reports based on topology and network areas
- Summary of cable lengths for each district
- Colourful visualisation of network areas
- Data lists exportable in MS Excel
Product Description
Current Flow Analyser
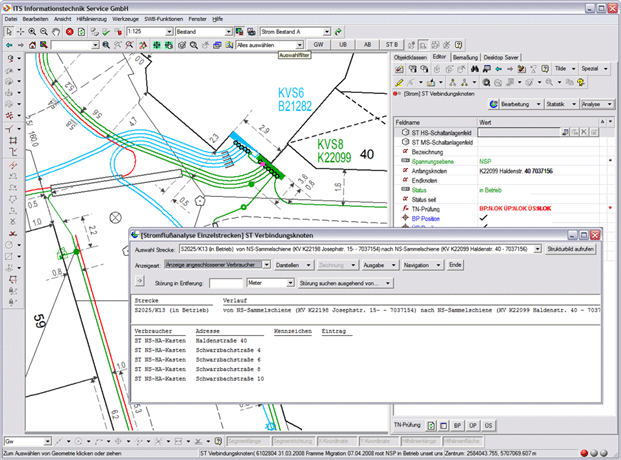
Using the Current Flow Analyser, it is possible to analyse data within the sector-specific data model for electricity. Starting at a specific network point such as a distribution board or an electrical substation, a topological analysis of cable lengths along with corresponding data and connected sleeves is performed. Based on cable types, lengths and electrical values, a calculation is carried out for the entire route in order to determine the electrical values of the defined route. These evaluations can be performed on all network voltage levels (also on telecommunication networks). The list of results can be printed, saved as a file or be porcessed further in Office products. All asset components are displayed with their current address. This is helpful to locate power outages.
During power outages, affected routes or GIS lengths of the route are evaluated to identify the location of the disruption. These results are displayed in colour in the main window. The Current Flow Analyser is available to be used as a service for SIAS. A new function of the Current Flow Analyser is the identification and allocation of assets belonging to a specific route including different branches of the route. Furthermore, it is possible to add adjoining routes to the evaluation after the analysis has already started. Assets are also identified and allocated for each route.
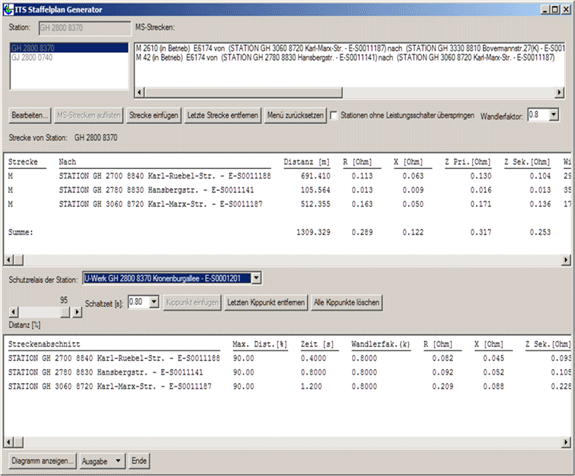
Relay Plan
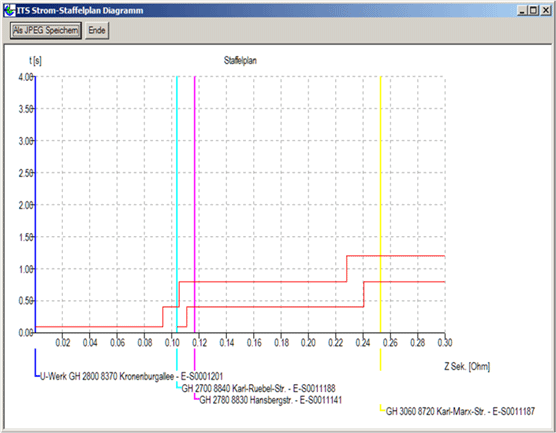
The Relay Plan is a complementary module for the Current Flow Analyser. It uses the Current Flow Analyser’s results to determine the power system protection setting for medium voltage power levels. A menu is available to display all power stations in a list. These power stations can then be be selected from the list. Subsequently, parameters for the power system protection can be defined in the menu. After defining parameters for selected power stations, values for the relay plan are automatically calculated and displayed in a diagram. This diagram can be saved as a jpeg file.
Creation
The Relay Plan documents how system protection has to be set in order for a switch to be triggered when a short circuit occurs within a specific maximum distance and time. For example, a power distribution station should be switched off after 0.4 seconds if a short circuit occurs within 90 % cable distance to the nearest station. However, the switch should only react after 1.2 seconds if a short circuit occurs near the closest station or beyond this station (relay of nearest busbar). The Current Flow Analyser provides basic data such as information about connected power stations and electrical values (R/X) between these power stations. The engineer chooses the routes that should be displayed in the relay diagram, i.e. routes required for planning a relay zone. These plans can also be printed. In addition, the application also calculates value settings for power system protection and prints relay plans with a calculation proof.
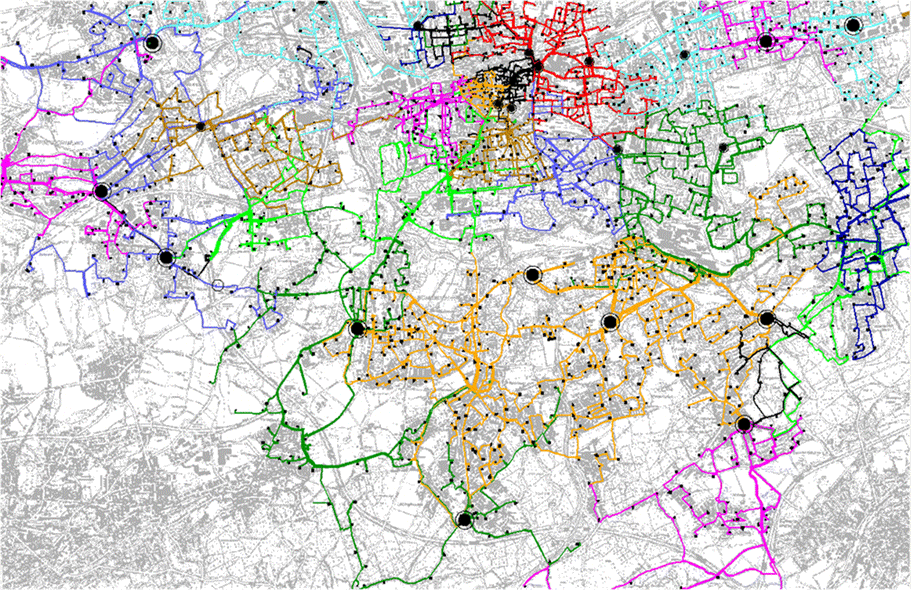
Circuit Visualisation in Colour
With the help of a colourful circuit visualisation, you can distinguish different parts of the network by its colour. The search for network areas is configured individually. Thus, different settings can be used for different purposes.